
VISION Portal
// UX + UI
From hand-built reports to a self-serve analytics product.
The VISION Portal shows how shoppers and employees move through a retail space, with no facial recognition. Before it, customers got data feeds and decks we built by hand: nobody could interact with the data, or see where in the store it came from.
I designed the portal end to end as the sole product designer, and since July I build the front end too. Below are the features, and what they changed.
Overview
Website analytics for physical stores.
Role:
Sole product designer. Front-end builder since July.
Tools:
Figma, Figma Make, Claude Code
Date:
November 2025 - Present
Decision & Features
Visual data, on store layout.
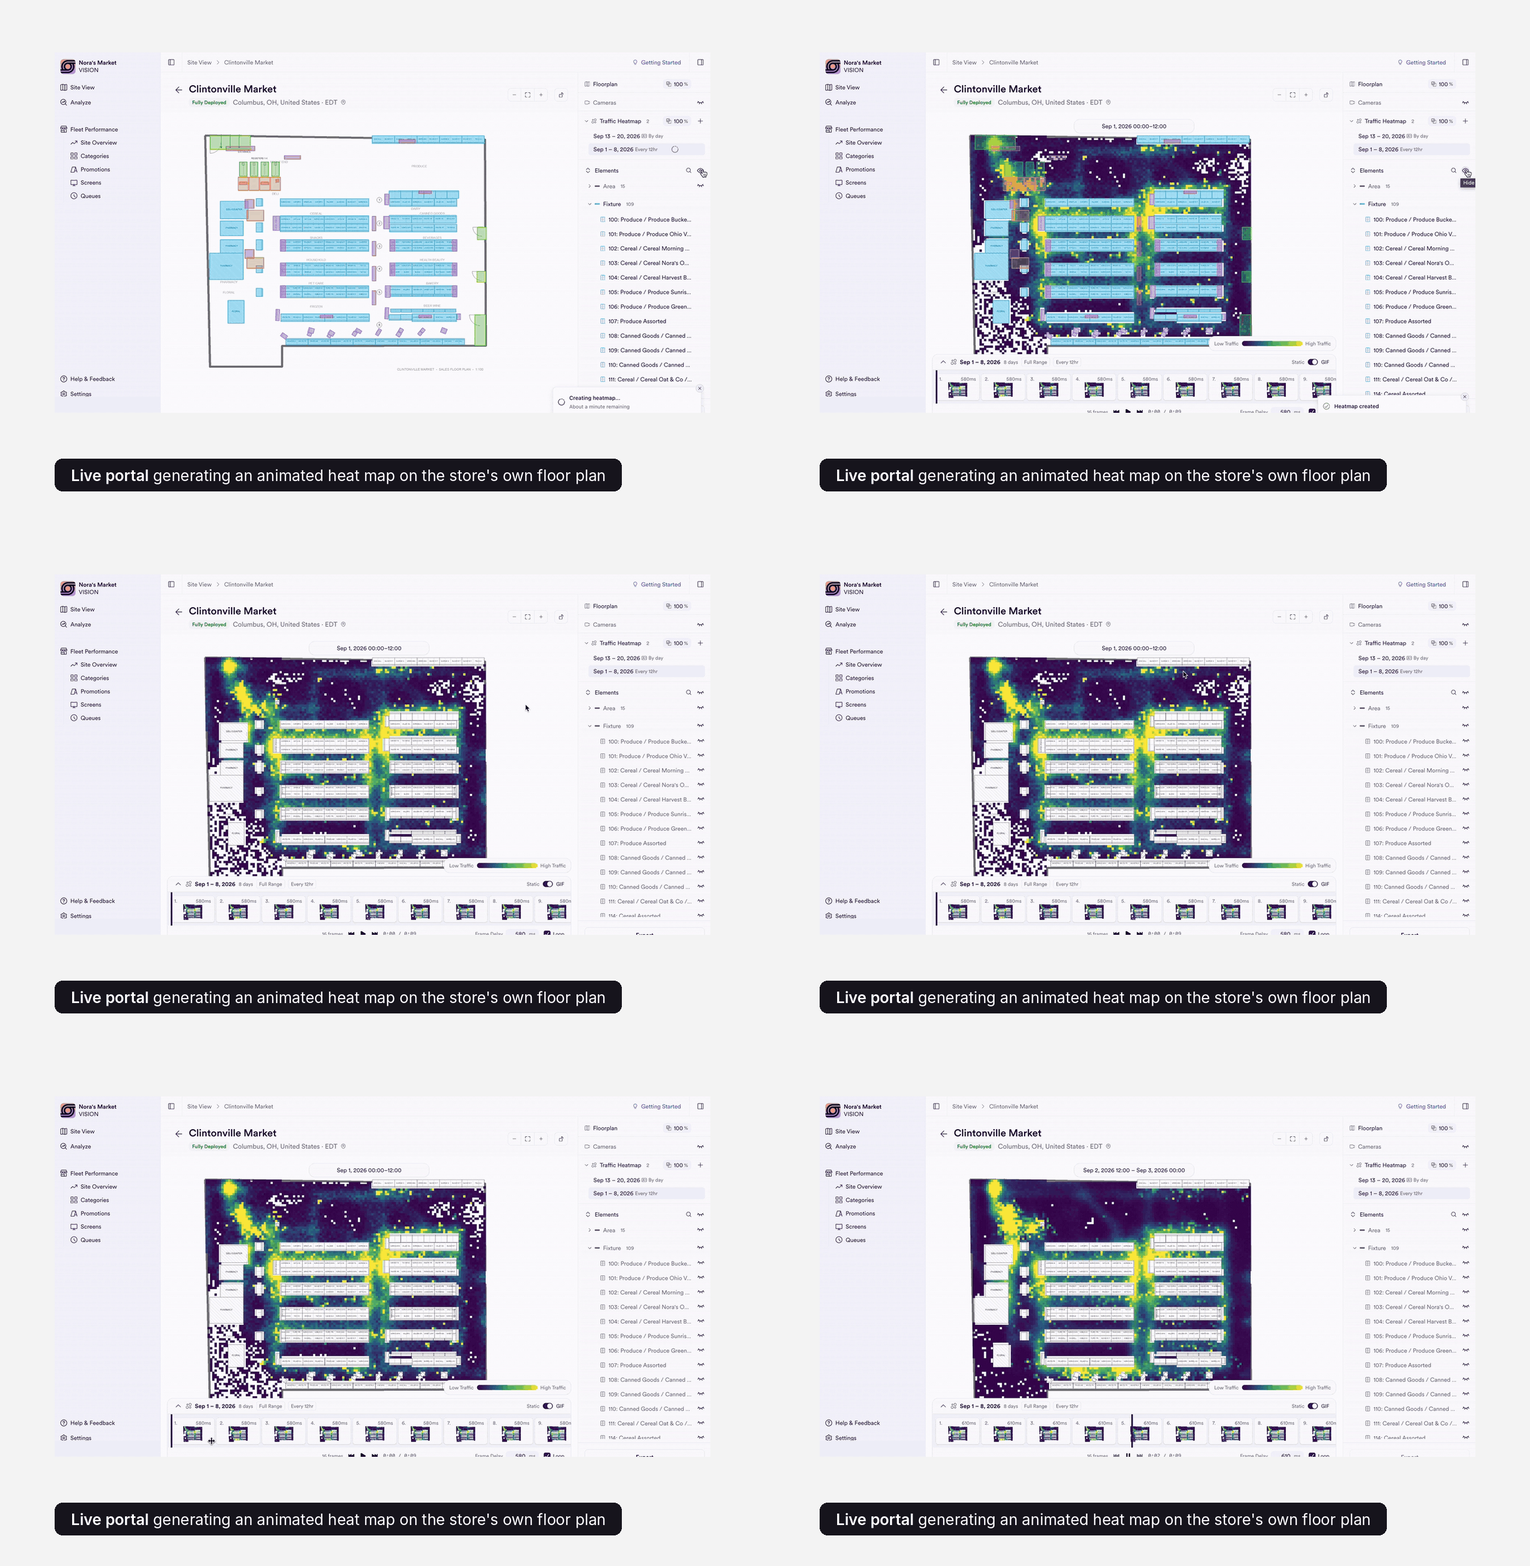
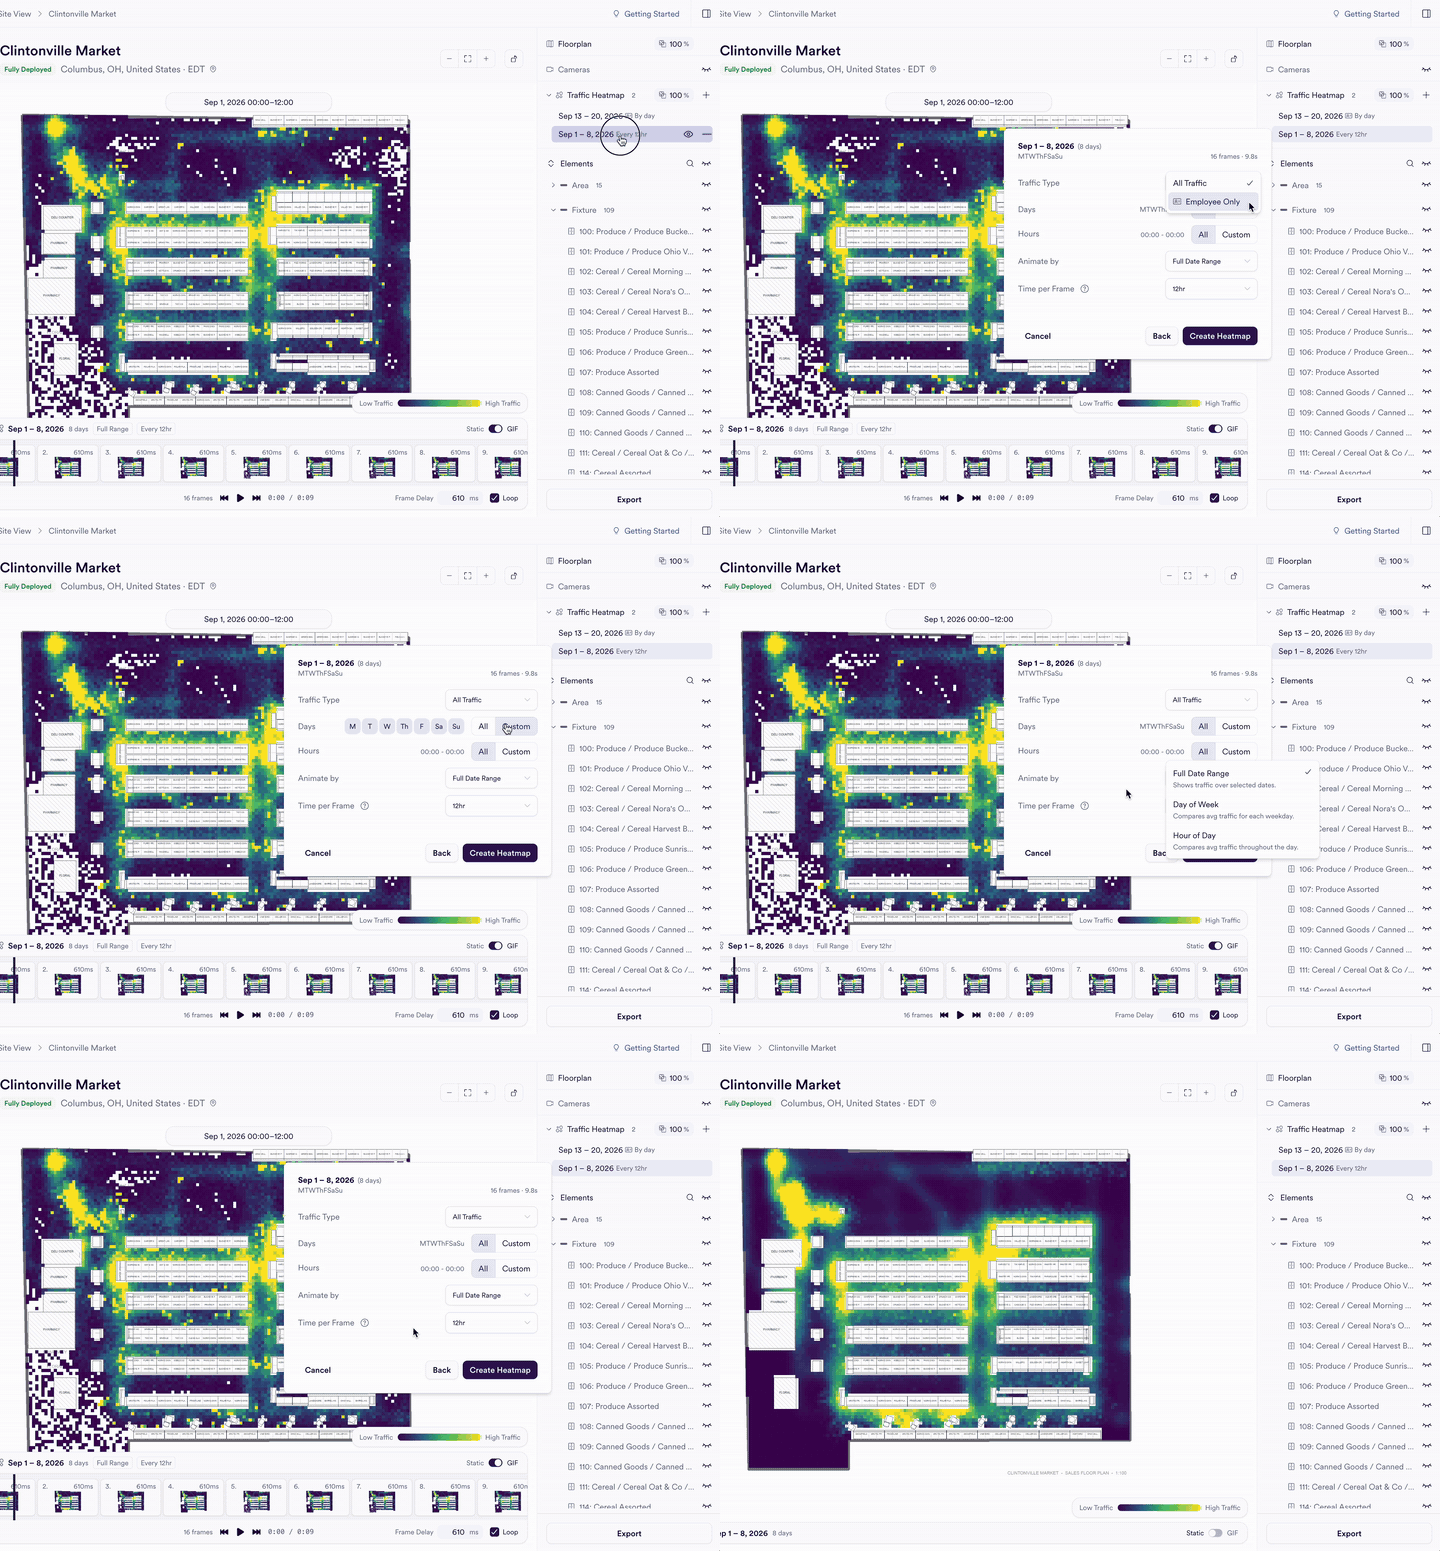
Every store uploads its own floor plan, and I draw the areas, fixtures and screens on top. Heat maps sit on the plan itself, so a spike in traffic reads against what is physically there.
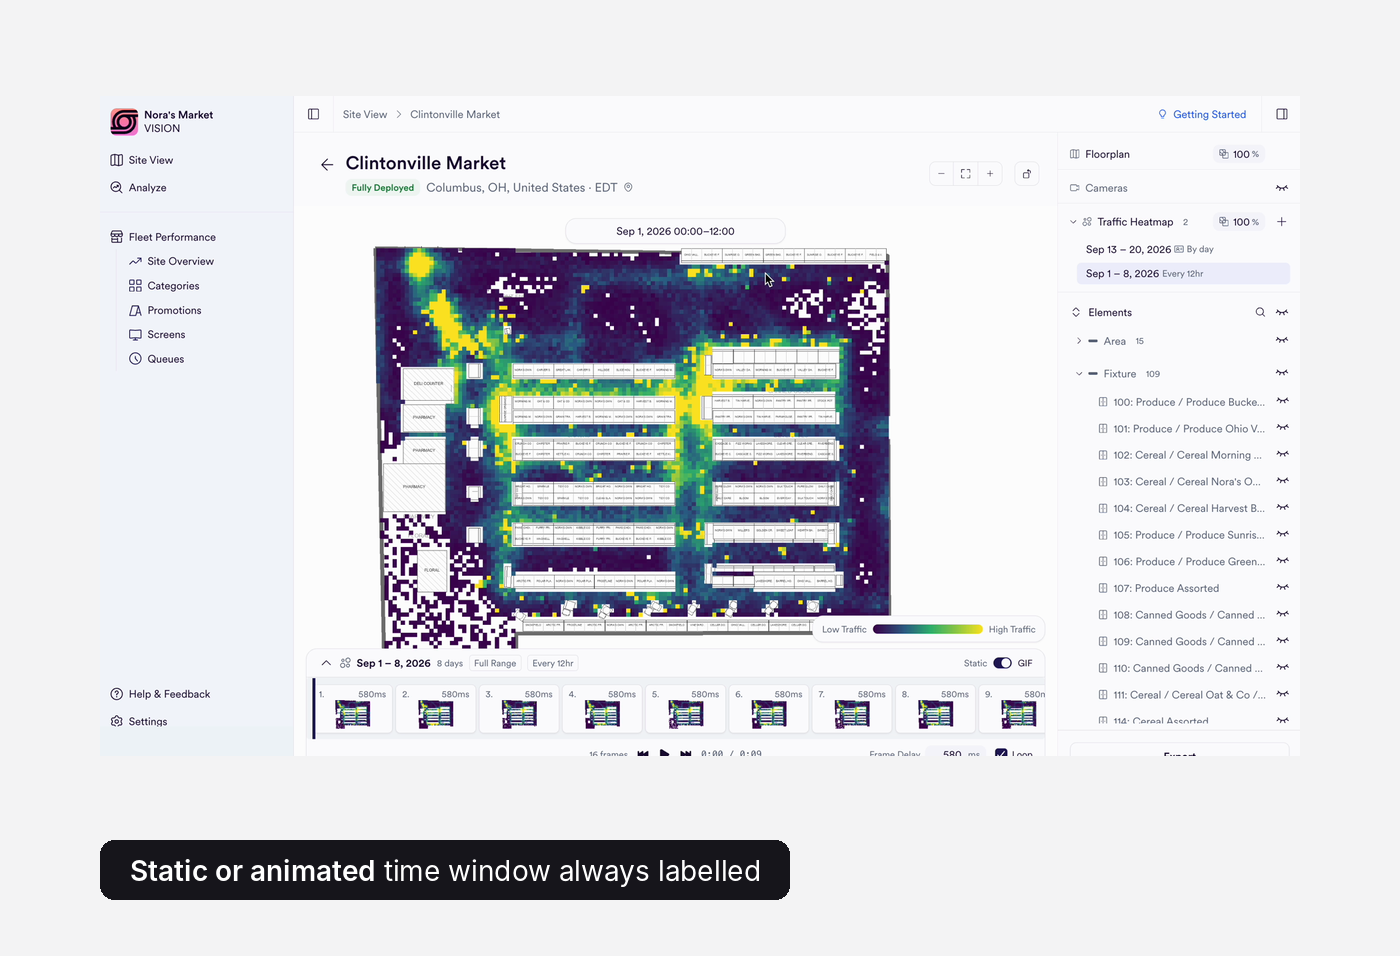
Static maps hid patterns by day and time, so I added frames: 16 across a week, with play, scrub and loop. Each heat map keeps its own date range, so periods can be compared.
//SITE VIEW
Understand where the data is coming from.
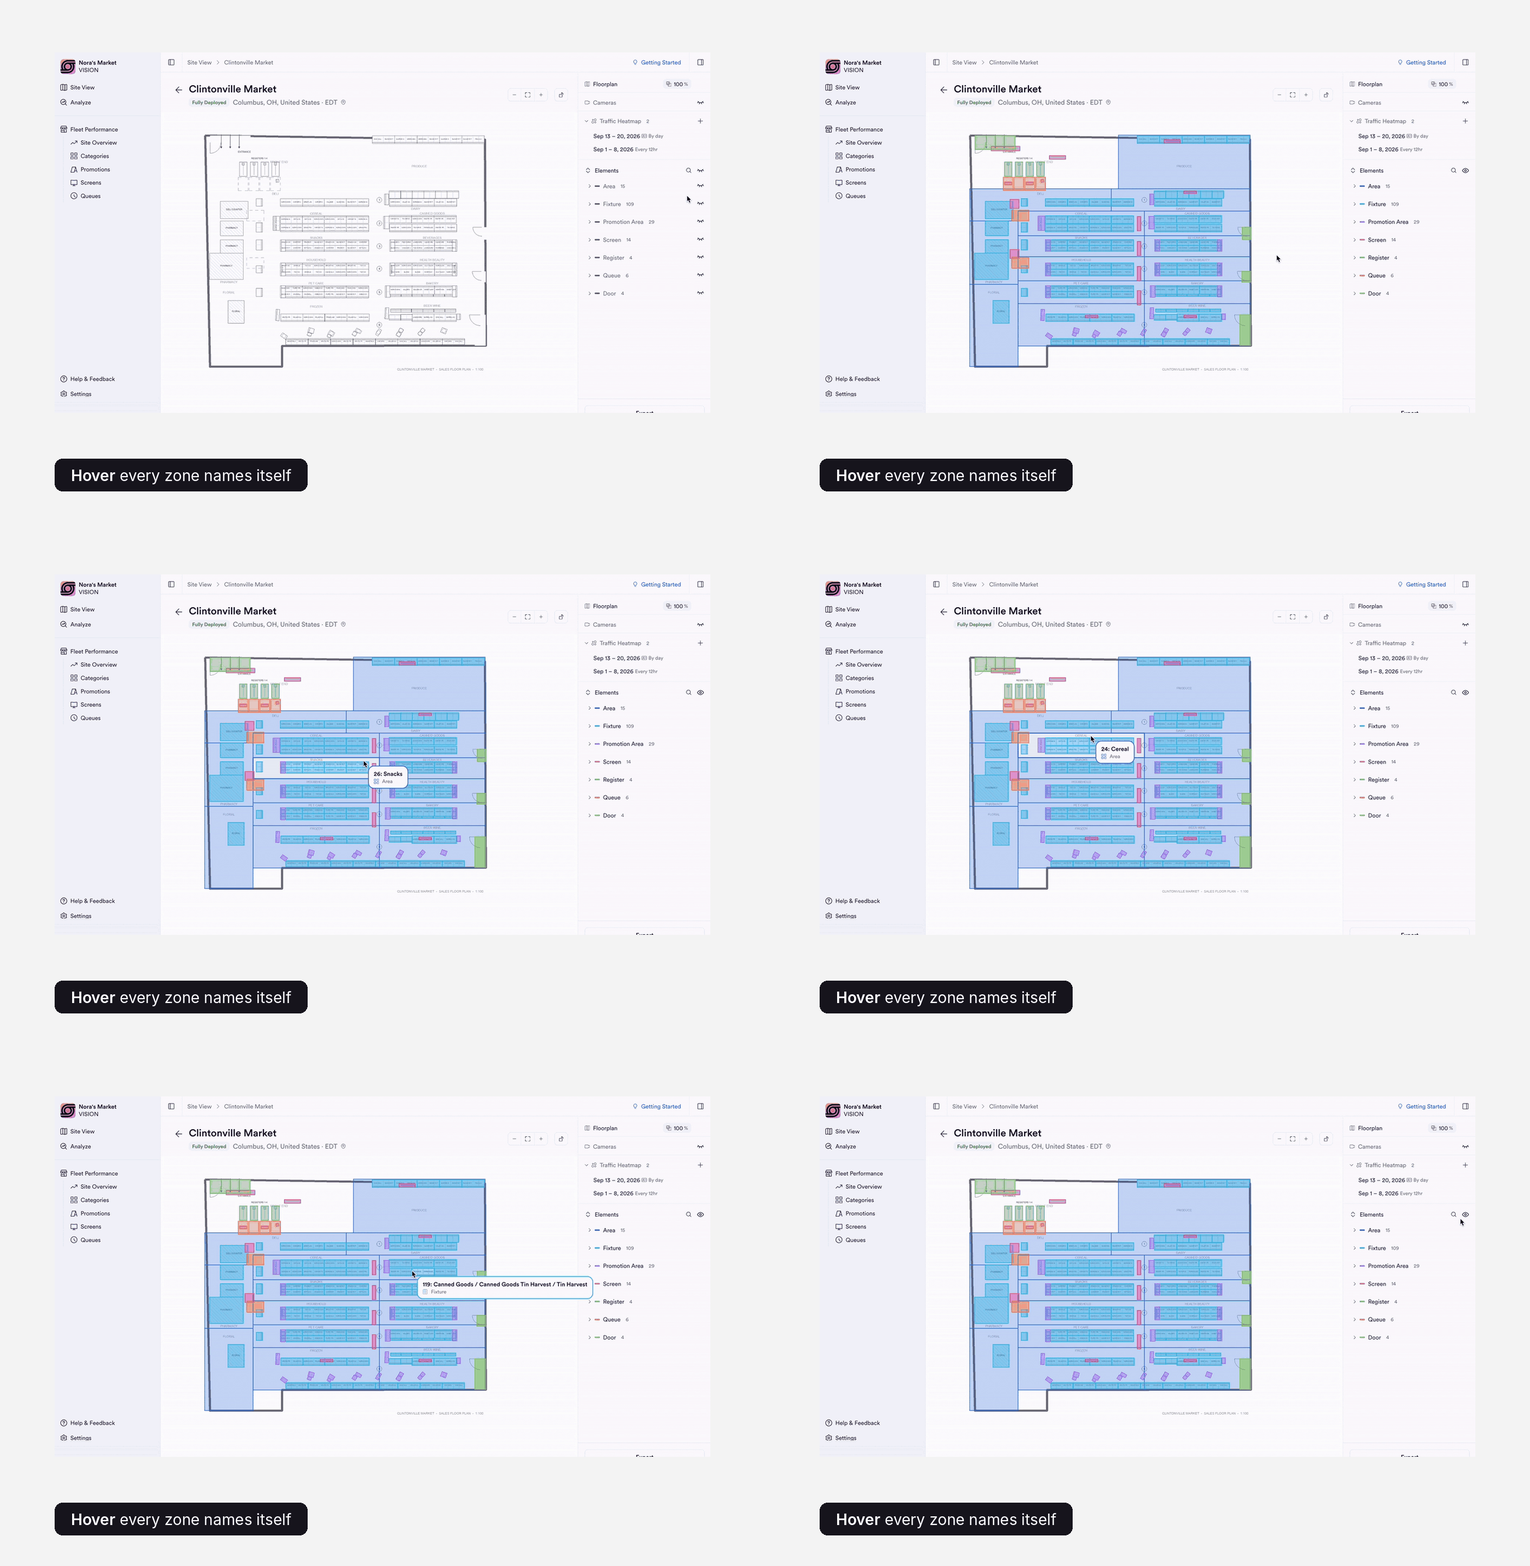
An area, a fixture, a screen, a queue. Hover to identify it, click to go deeper.
Areas and fixtures can be switched on and off (15 areas and 109 fixtures in this store), so the map shows only what a user is asking about.
Ready to share your weekly reports.
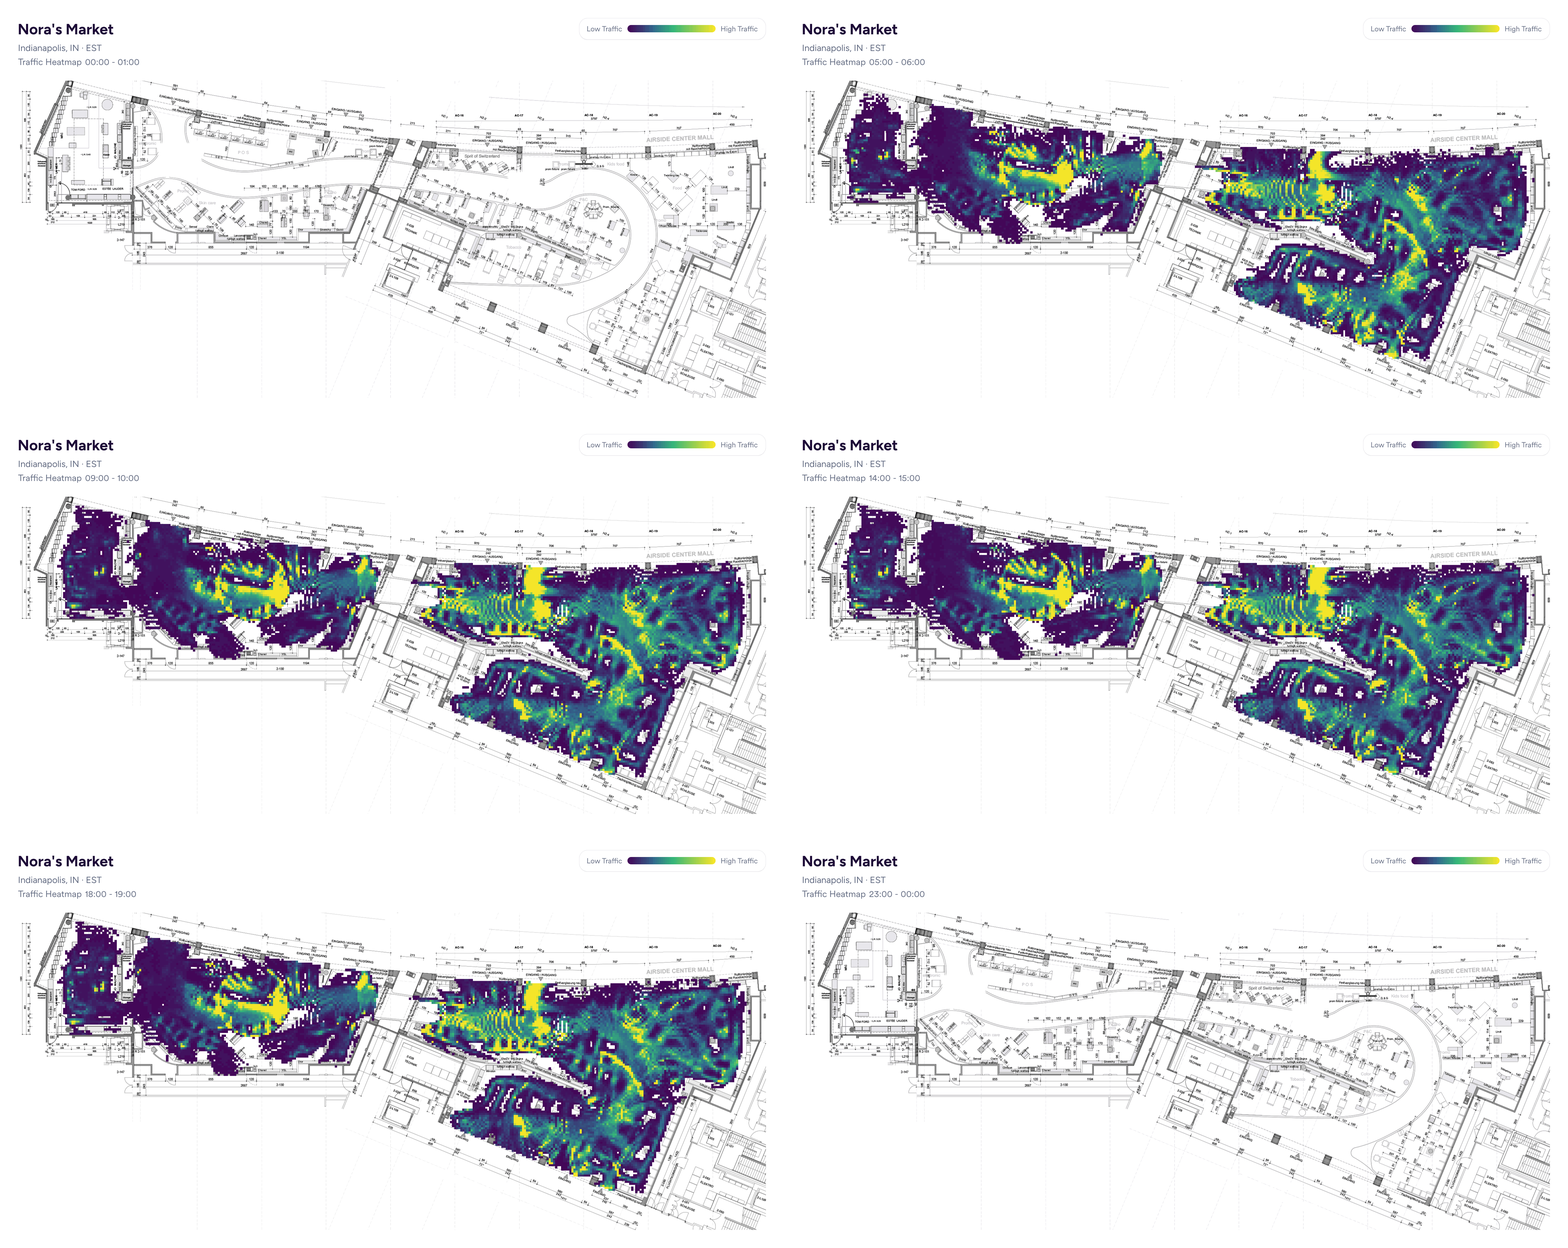
Any heat map exports as a GIF or imagethat steps through the day, with the time window labelled on every frame.
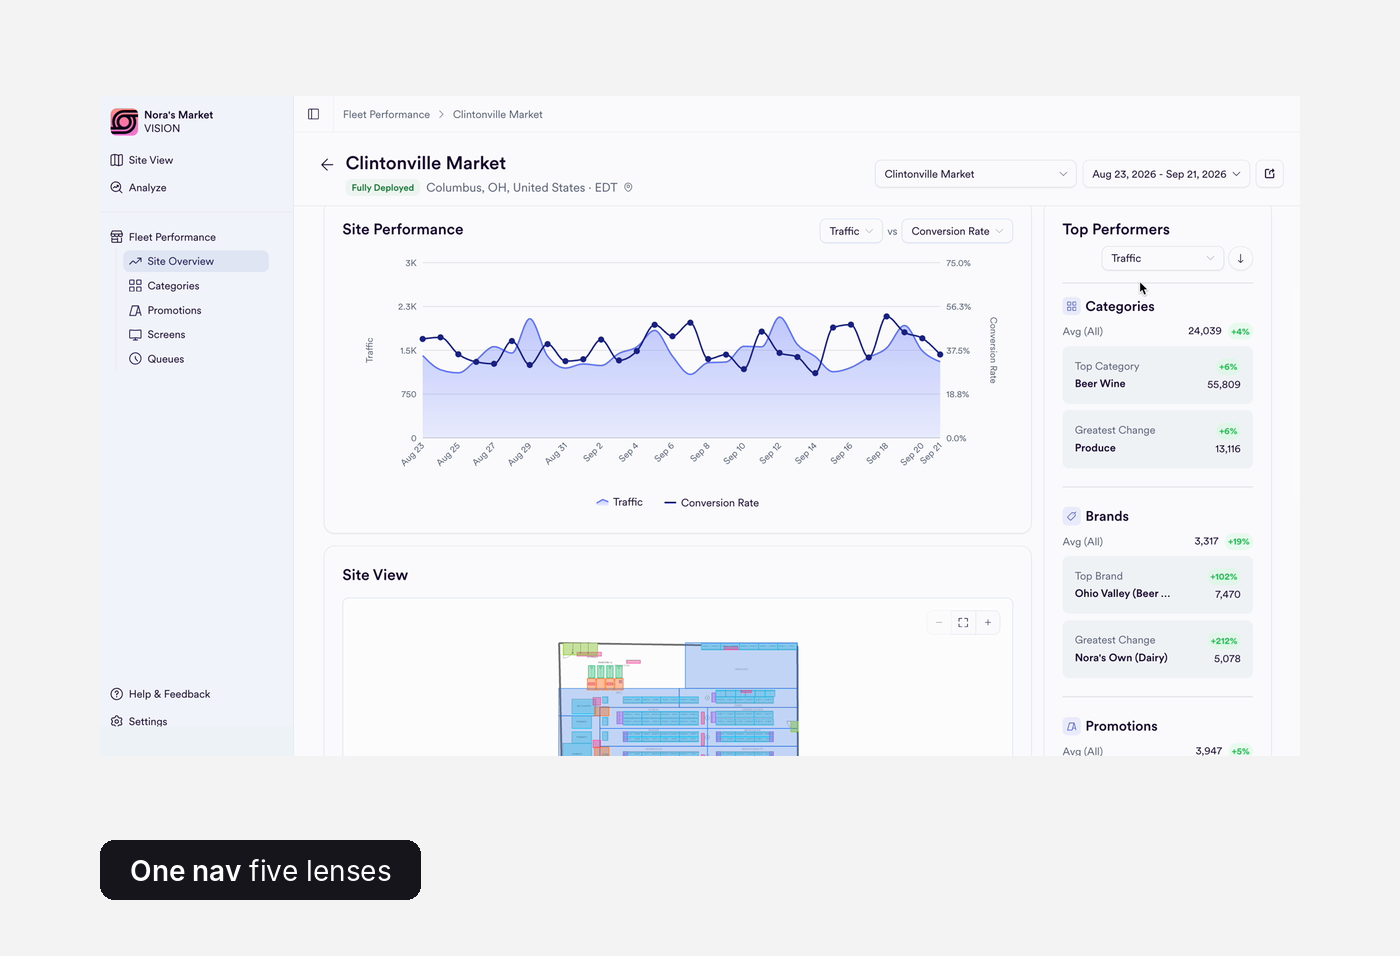
Start wide, then narrow.
Site Overview, Categories, Promotions, Screens and Queues share one structure, so learning one teaches all five. Pick any two metrics and see how traffic and conversion move together, day by day.
Top performers link through, so spotting something and exploring it are one click apart. The floor plan preview stays right under the trend.
//FLEET PERFORMANCE
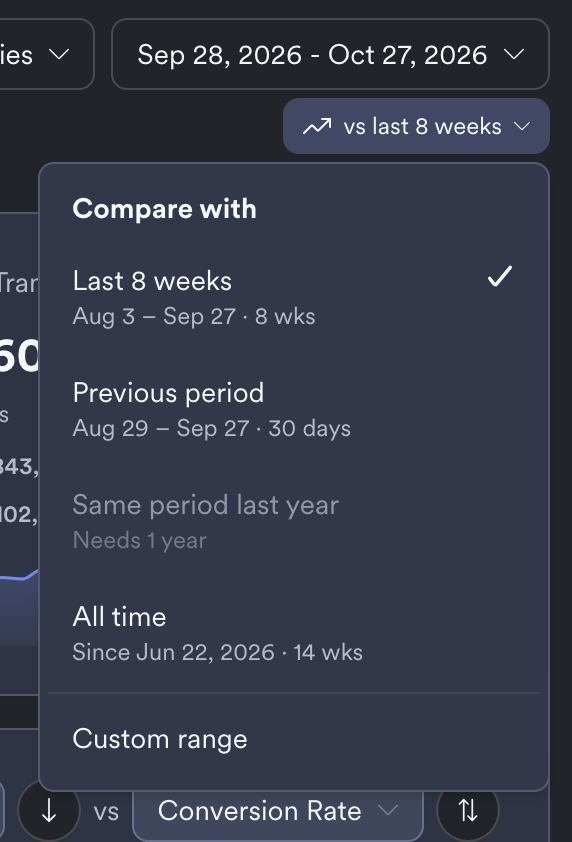
Change the baseline
One control sets what every trend badge is measured against: last 8 weeks, the previous period, all time or a custom range. The KPI cards and the site table update together.
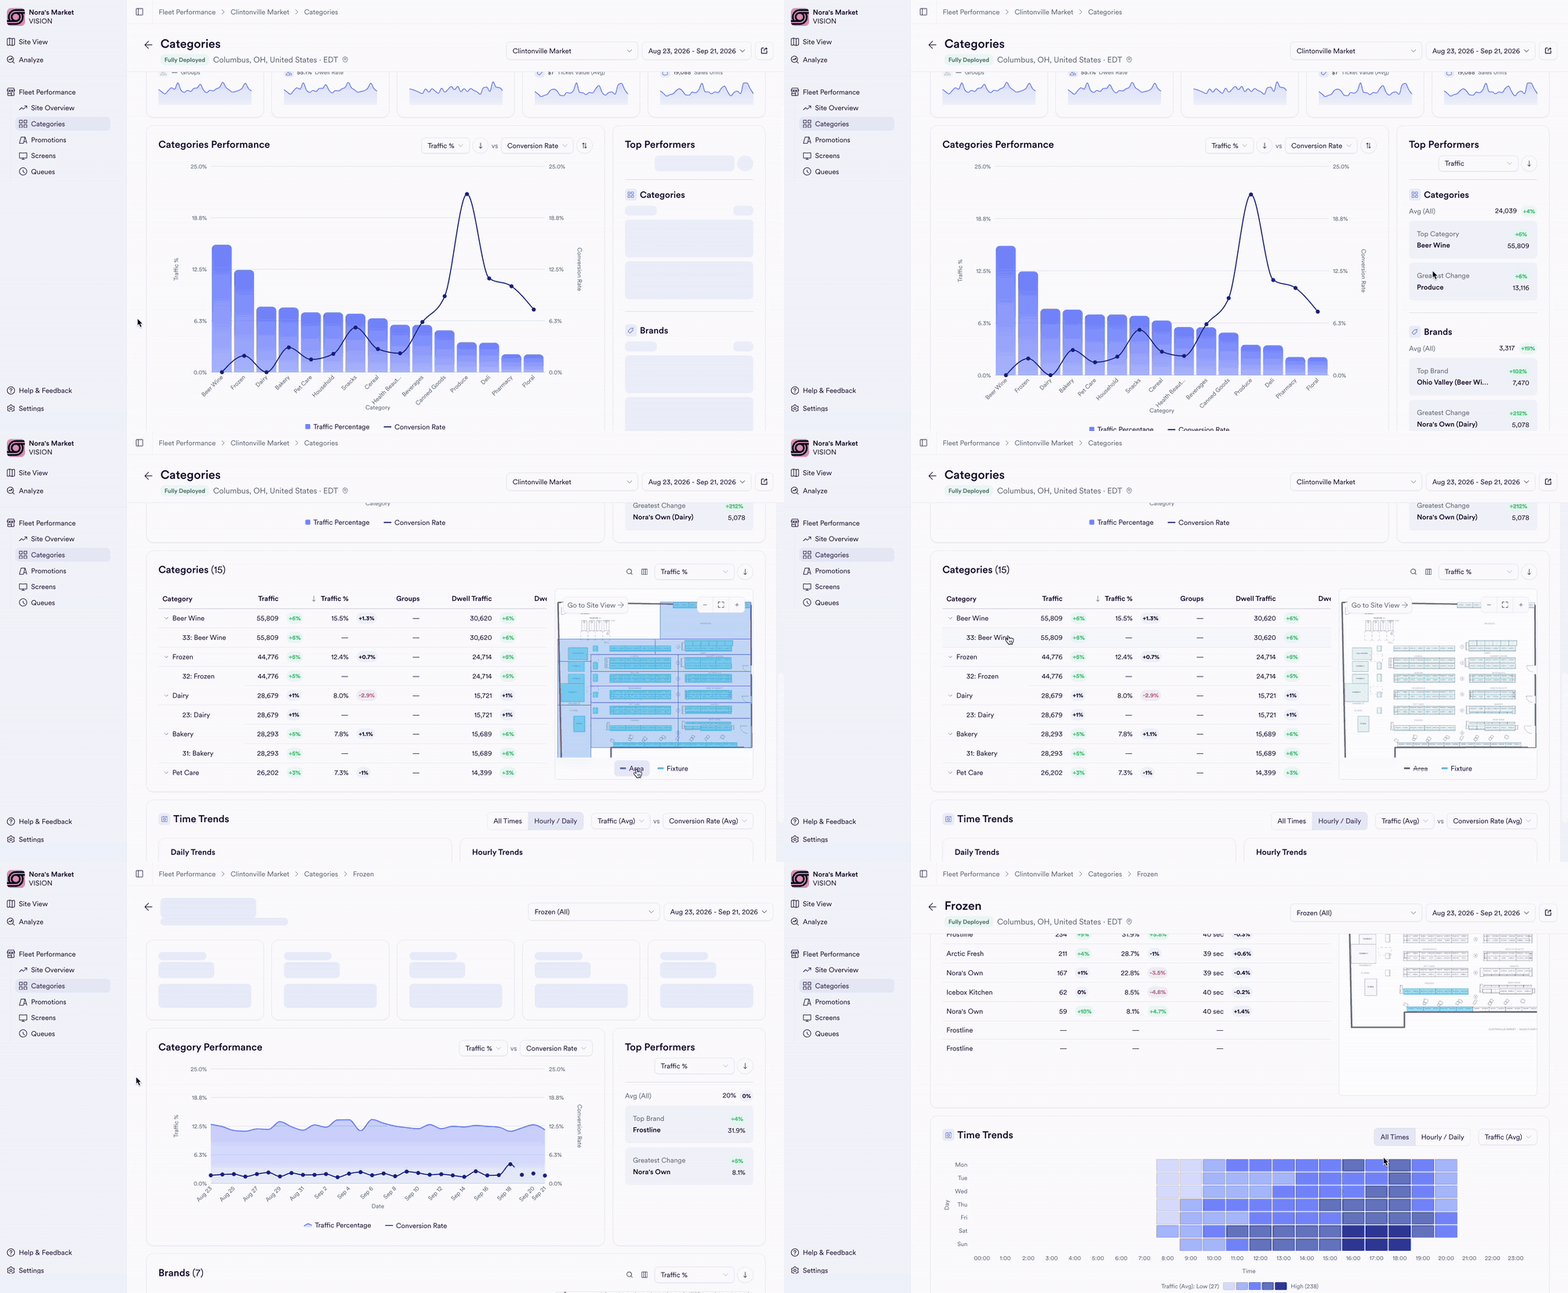
Built for scale
Nesting-doll layout
Sort by any metric, expand a category into its fixtures, and read change against the previous period as colour-coded pills.
Hovering a row highlights it on the floor plan, so a row can always be found in the space.
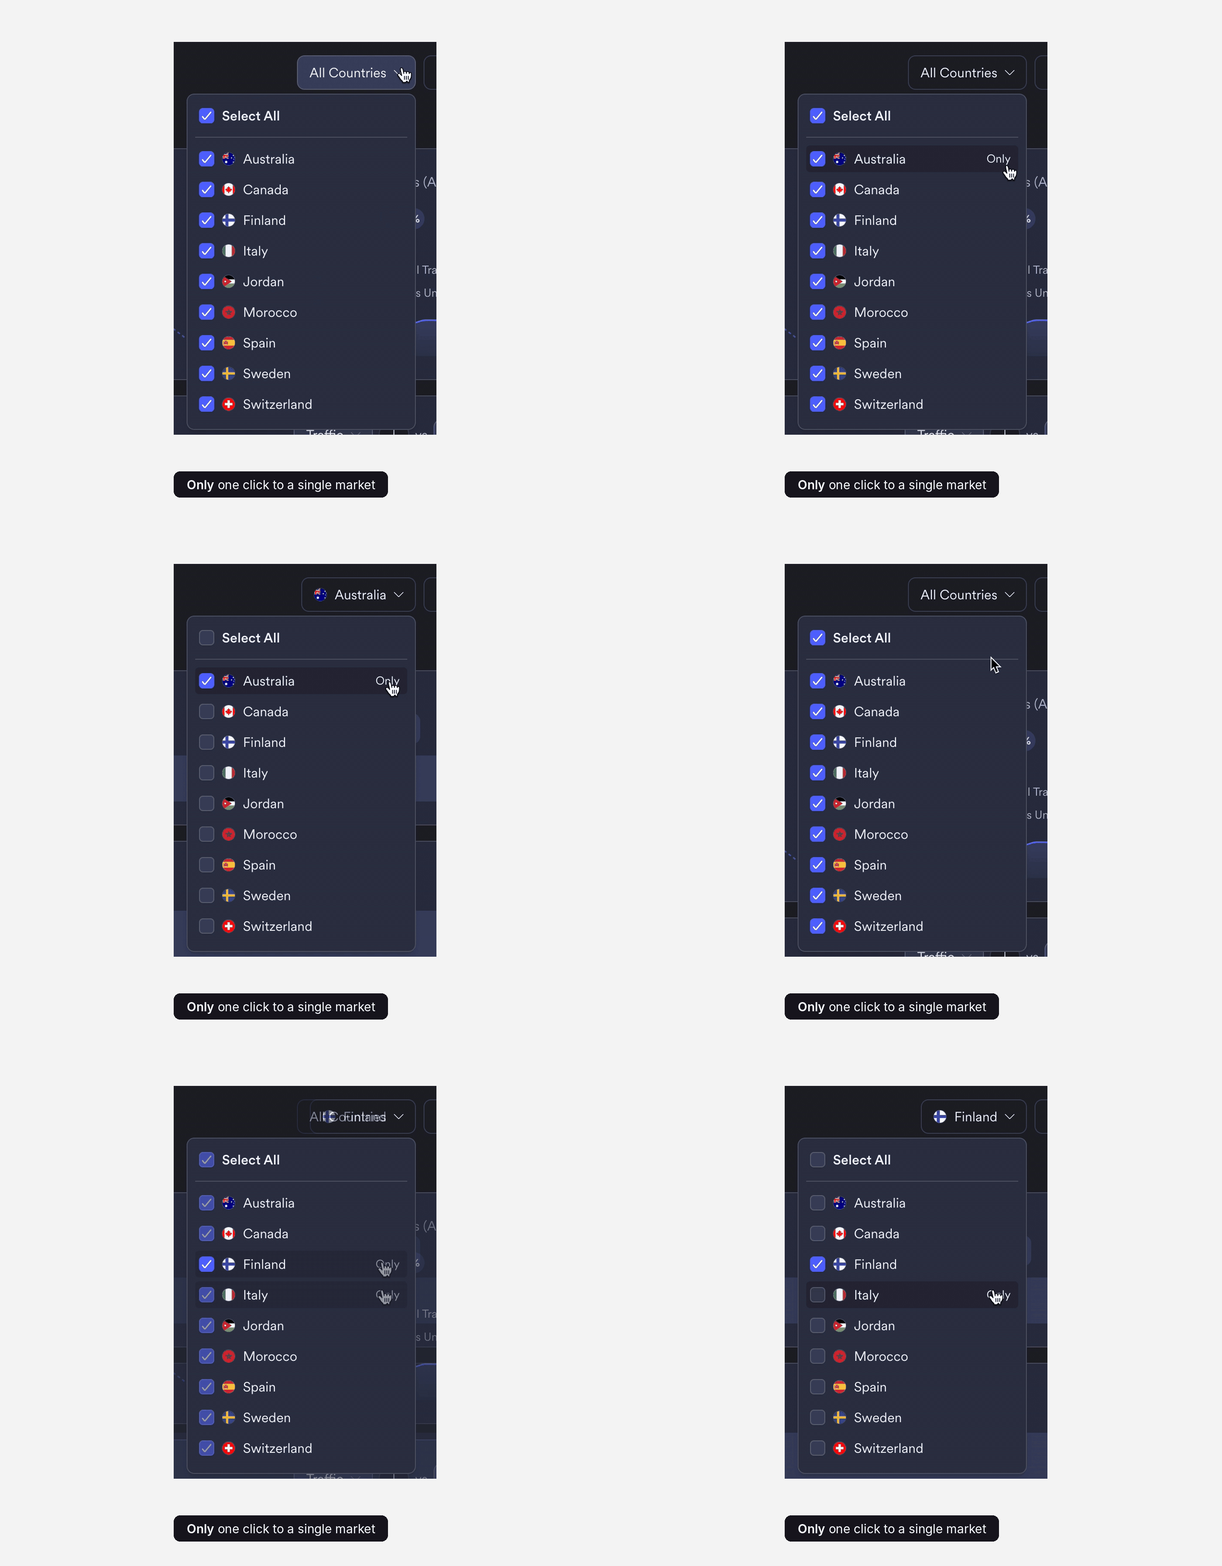
Tick any mix of countries, or hover a row and hit Only to jump straight to one. Select All brings everything back.
The button summarises the choice (“Australia”, “Finland, Italy”) so you always know what you're looking at.
A/B testing physical spaces
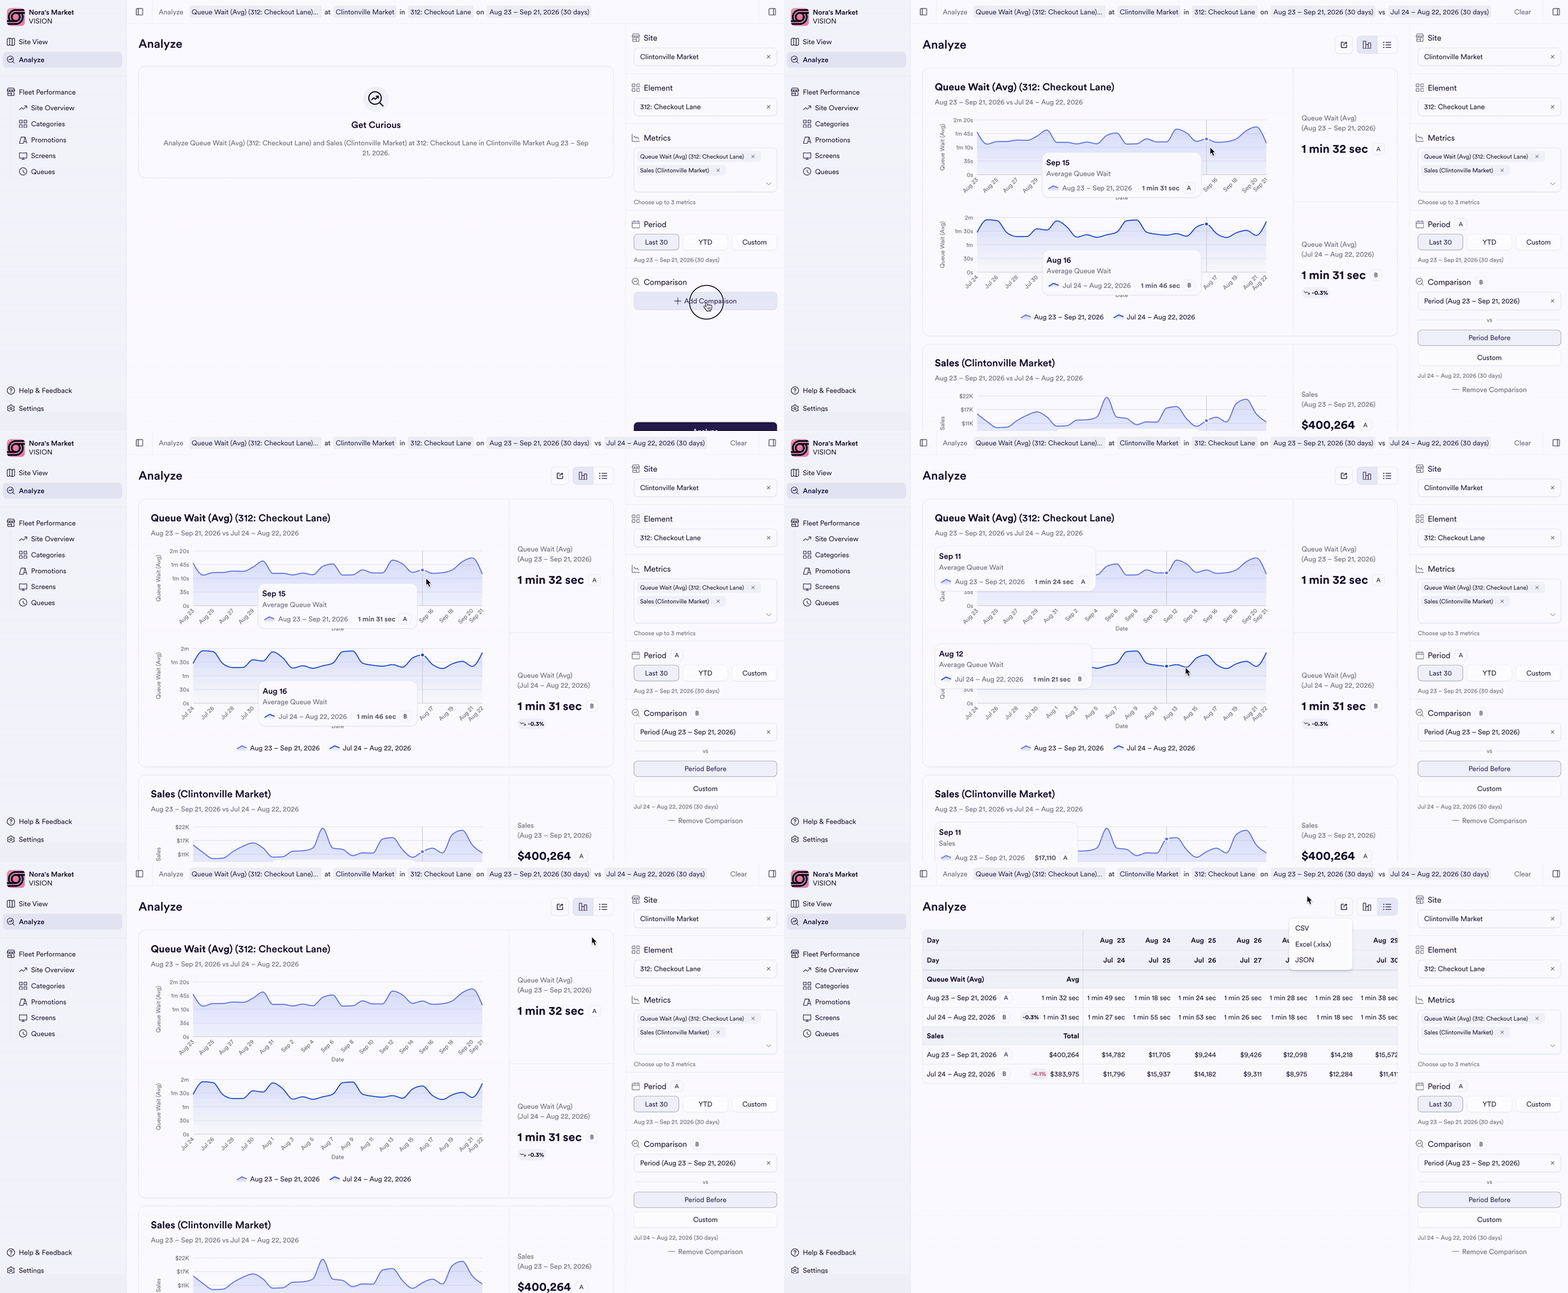
Pick a site, an element and up to three metrics, then a period and a comparison. The query writes itself into the header as a sentence you can read back.
Hovering one chart aligns the other period at the same position, so shifts are easy to spot. Teams stop emailing Analytics for a one-off chart.
//ANALYZE

Business Impact
2–3 → 0
hand-built reports a month, once pilots move into the portal
100s of live users
3x increase
in open deals shaped by interest in the portal